Every goal starts as an opportunity // Jens Bäck
Today we have a guest appearance on xProgress. I met Jens Bäck during a lecture I gave in Uppland, Sweden. We talked about decision making and the connection between eyetest and numbers.
I asked Jens if he wanted to contribute to xProgress with how he approaches data and how it can lead to goal scoring. Among a lot of interesting things in his text, he does a comparison of floorball to ice hockey from a scoring chance and goal scoring perspective.
Enjoy the read from Jens below! /David
Jens Bäck is 47 years old and coaches at FBC Sollentuna in Sweden. He has a football and hockey background, but floorball became his primary sport 10 years ago. He is big on player development, on-court behaviours and decision making in game situations. He likes merging eyetest with number, to try and understand patterns and specific situations that can be advantageous in floorball. He likes a high-rish, high-reward mentality with high tempo.
Want to get in touch with Jens? Reach out to jens@kulmed.se or via social media.
Every goal starts as an opportunity
Every goal begins as an opportunity—a situation where anything can happen, yet most chances ultimately come to nothing. But are all chances equal, and if not, which ones truly matter?
In the pursuit of offensive efficiency, it is valuable to understand which situations, statistically, give us the best chances of success. Naturally, the same understanding is just as useful from a defensive perspective: knowing which situations you want to avoid ending up in.
In the matches we have logged (23), tracking scoring chances (1081) for and against, roughly 8–9 minutes of a game consist of goal-scoring situations, with each sequence lasting around eight seconds. That is a relatively small portion of a match where the decisive moments, goals scored or conceded actually occur, making it well worth a closer look.
When comparing floorball and ice hockey, two sibling sports built on similar playing principles, a clear pattern emerges. Naturally, there are differences depending on available data, level of opposition, and other contextual factors. What is interesting, however, is not the exact numbers but the recurring patterns themselves. In this article, I share my reflections on the significance of various goal-scoring situations. It is worth noting that there is always an element of subjectivity in how situations are defined and logged, including which moment is considered the “decisive” one. The ice hockey data referenced here is taken from the NHL, overall season data, with help from ChatGPT. There might off course be differences in how to interpret situations and logging of data.
Transition phases in games
Transitions are the game situation with the highest probability of resulting in a goal when they occur. They often happen in combination with other effective actions such as one-touch shots and almost always involve some form of defensive breakdown. When we create these situations, the likelihood of scoring is simply very high.
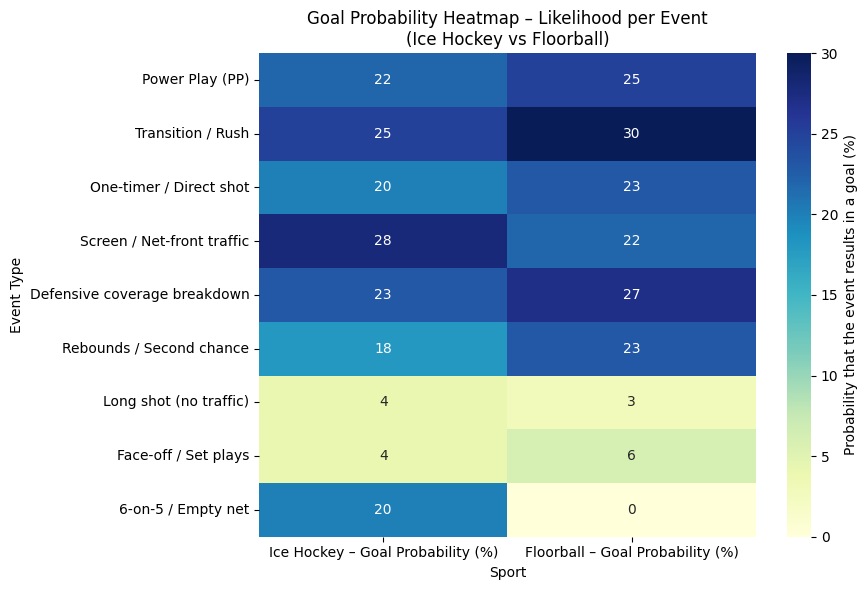
The main reason transitions are so effective is that the defense is disorganized, often facing the wrong way, and everything happens at speed. This opens up spaces that are otherwise difficult to create—ranging from marking errors to passing lanes that force lateral movement from the goalkeeper. In both sports, transitions are among the most dangerous phases of play. However, floorball shows even greater returns here: around 30% of transition chances result in goals, compared to approximately 25% in ice hockey.
Defensive breakdowns
Situations where an attacker appears unmarked behind the defense or a defender becomes ball-watching are also highly effective, with a conversion rate of around 27%. Floorball teams are punished more severely here than hockey teams, where space and equipment provide defenders with greater margins for recovery. These situations are nearly as effective as transitions, and the two often influence one another.
It is, of course, easier to create defensive breakdowns against an unsettled defense following a turnover or transition than against a well-organized defensive structure, where ball speed and off-ball movement become decisive. Creating space and gaining that extra fraction of a second significantly increases the probability of converting a chance.
Traffic in front of the net
This is where ice hockey’s identity becomes particularly clear (28% compared to floorball’s 22%). In ice hockey, screens in front of the goalkeeper lead to goals more frequently, while floorball does not reward the same type of congested situations to the same extent - although they remain useful. This may relate to differences in playing area, visibility, distance, puck speed, and the high level of skill involved in directing shots in ice hockey.
Long-range shots without traffic? The numbers are clear: the probability of success is very low. Floorball goalkeepers read shots extremely well when they have a clear line of sight. Chaos is required to score from distance; otherwise, there is barely any point in shooting.
While we do not have specific data on this, it is not unreasonable to assume that long-range shots also carry an increased risk of leading to counterattacks if they fail to reach the goal. These are situations that must therefore be carefully evaluated.
One-timer shots and rebounds
Here, too, the conversion rate is high (23%, in floorball’s favour). This is likely due to the fact that these situations often coincide with defensive disorganization, marking mistakes, or combinations thereof, while the goalkeeper is not set in a prepared base position. These are short, fast sequences that demand immediate action.
Rebounds are also more effective in floorball than in ice hockey, making it worthwhile to generate traffic around the goal to capitalize on second chances. In this area, ice hockey goalkeepers benefit from greater ability to block and direct the puck compared to their floorball counterparts.
Interpreting the patterns
When we analyse these findings, a similar picture emerges across two closely related sports regarding which situations teams want to create to increase scoring probability, and which situations they want to avoid defensively.
In the next article, we will combine these probabilities with how frequently different situations occur, creating what we call a Goal Contribution Index. This will allow us to analyse which situations have the greatest overall impact on scoring.
If you would like to contribute your own data to help deepen our understanding of floorball’s offensive potential, please feel free to share it. A larger dataset benefits everyone.
/Jens Bäck