🚨Goalie performance - why save percentage is a bad stat
We live in a floorball world, where we are very limited in terms of getting provided with relevant statistics. Take the best league in the world, for an example. In the SSL, we are provided with next to nothing.
For the teams we get no shot share statistics (Corsi, Fenwick etc) to be able to see which teams are driving play. We do get some team based PP and PK stats, but that is it. For players, it is more or less only points. We do not even get plus/minus – which is of course a pretty flawed stat, but still.
For goalies, we get save percentage (without the correct number of starts for the goalies, it just says the number of games they have been on the roster for games!). And when I hear some kind of goalie analysis in broadcasts from the SSL, the only "analysis" we will get from people trying to voice their opinions, is a comparison of save percentage. Which to me is a very flawed way of judging goalie performance. And because of the media landscape in floorball being very centred around few sources, this becomes gospel for a lot of people.
I am not here to say, that every floorball person connected to a broadcast (or coaching), has to know a lot about the art of goaltending. It is for sure pretty different than the field player position, and most of people who have played floorball, where for obvious reasons not goalies. I get that.
But using save percentage to try and describe (and maybe even critizise) a goalie, is a thin layer of ice to walk on.
Why is it a bad statistic for goalie performance?
Well, first an foremost, save percentage as a stat does not take into consideration, what kind of shot is being tracked. It could be an open net on a three-on-one situation, with the ball being played over the central line twice. It could also be a shot from the middle line without any previous lateral ball movement.
The save percentage stat could not care less about what happened previous to the shot. It is just about whether it ended up as a save or a goal.
I have had this discussion with several goalie coaches working with players high up in the league system, and they would also use save percentage as a measure for performance or their goalies, which really makes me confused. Maybe that also says a lot about the lack of data?
The easiest case to make, is of course to picture two goalies in two vastly different goalie environments.
- Goalie A | Playing in a possession heavy team, that dominates most games in terms of tilting the court in their favour. When shots and scoring chances against do come, it is often in transition. Not a lot of shots against, but high danger stuff when something comes the goalie's way.
- Goalie B | Playing for a team spending a lot of time in their own zone. Pretty defensive minded team. Lots of shots from the perimiter, pretty high work load for the goalie.
Do you think these two could be fairly compared through save percentage? Not a snow ball's chance in hell. They will face totally different obstacles.
Save percentage to me, is actually more of a team stat than a goalie stat. It tells more about what type of scoring chances a team give up, than the actual performance of the goalie.
How could it be done better?
A very easy way to do it with your own team – without bigger resources – is just to use my system for grading scoring chances, and look at save percentage split up repectively. Track save percentage from scoring chances separately, coming from high, mid-high and mid danger scoring chances, as well as the low danger shot attempts (that I do not consider scoring chances). This way, you would pretty quickly build up a feeling for an expected save percentage for a certain goalie for each danger category, and your goalies will be more fairly judged after what type of shots they face.
Of course, there are more complicated ways to do it. Let us use a real case study. Viktor Frejd, the back-up goalie for Falun.
Being the back-up goalie on Falun's SSL team
Viktor Frejd is in a tricky spot
According to starting lineups (after having checked the starting line-ups for each Falun game this season, since we cannot find goalie starts), Viktor Frejd has started two games for Falun in the men's SSL. Hovslätt and Strängnäs at home. Two teams that just got promoted to the highest league.
Not really a "everything to win" situation for him, eh?
I really do not get when teams play their clear back-up goalie at home against teams that should be in the bottom of the standings, when looking at the roster quality. Give him starts away against teams in the middle portion of the league. Take away some pressure, give him a decent work load in terms of shots.
I guess you can guess what types of shots he will be facing at home against Hovslätt and Stängnäs, with Falun attacking with four and a half player and giving up the occasional breakaway against.
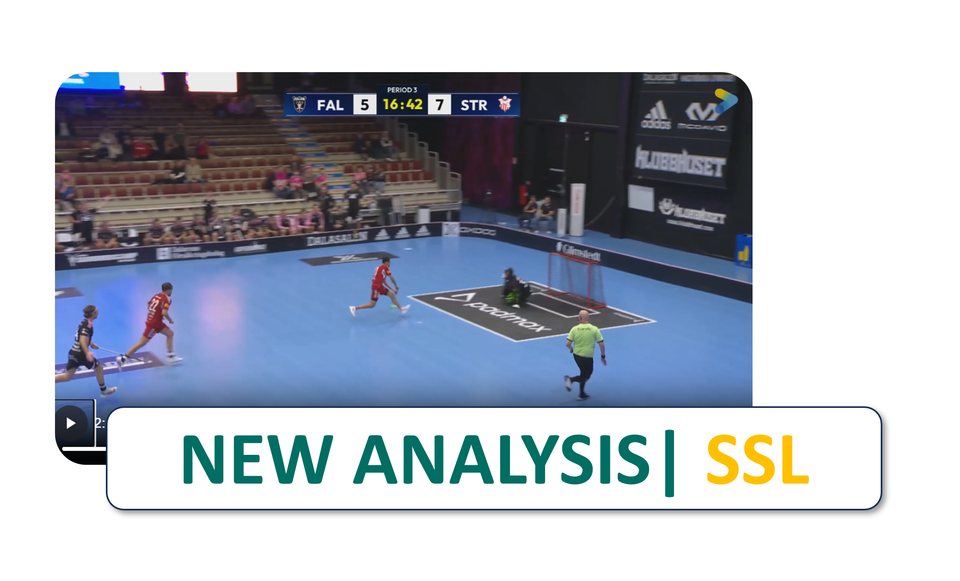
Let us have a look at the Strängnäs game Falun played recently. They lost the game 5-7 on home court. I only tracked the scoring chances for Strängnäs, but teritorially – most of the game was in the offensive zone for Falun. And then Strängnäs popped out for high danger stuff.
Let us use save percentage to analyze his performance
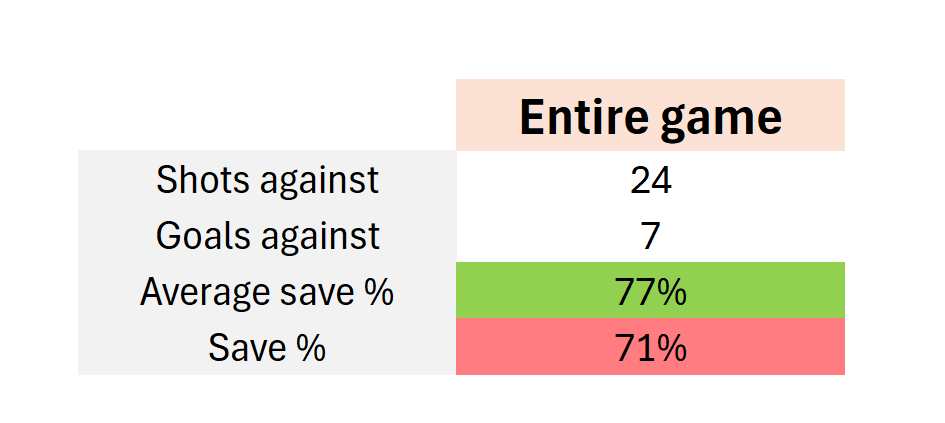
Looking at the save percentage, it for sure looks like Frejd had a weak game. The average save percentage for the SSL in 2024/2025 was 77%. Frejd got to 71% in this game. So way below that mark.
Luckily enough, this is not the entire analysis we will do here at xProgress. Let us keep on digging.
What type of defensive environment was he playing in?
As we have figured out by now, save percentage alone is a very flawed statistic. Let us look at the defensive environment Frejd was in for this game.
Strängnäs created a lot of high danger stuff, despite having to defend in their zone for most of the game. But when they broke out, they created big scoring chances.
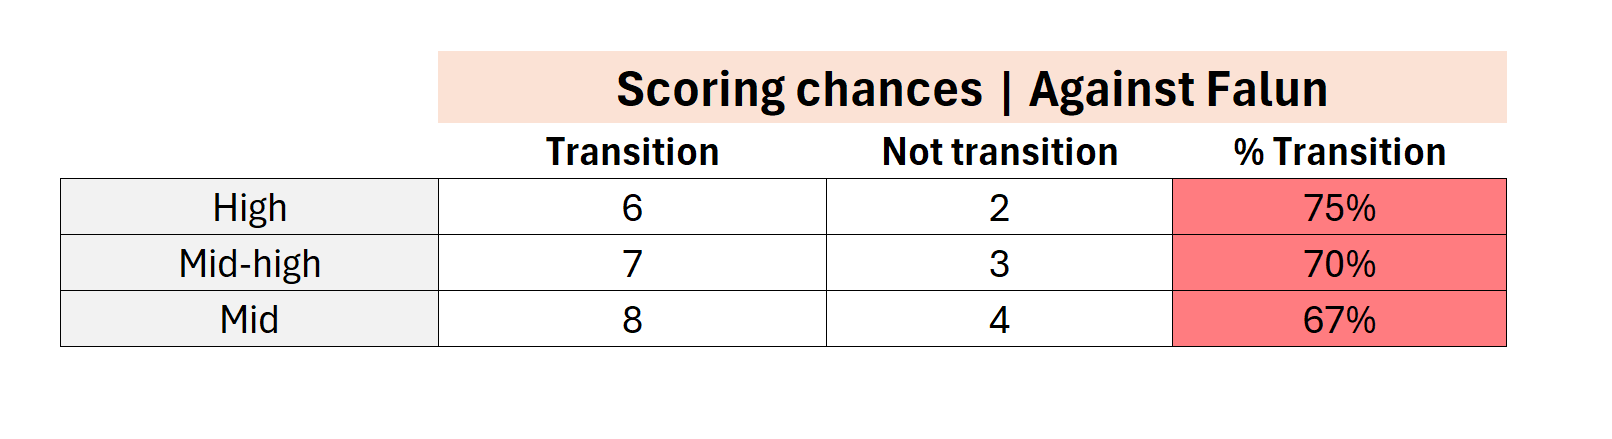
They created 18 big scoring chances (high or mid-high danger shot attempts) in this game, which is a lot. 8 of them were high-danger, which normally is enough to win a game of floorball. More than 70% of them were on offensive transition, which typically is a tough type of scoring chance to face as a goalie.
A good statistic for goalie performance
One of the best ways of analyzing goalie performance, is to look at a stat called Goals Saved Above Expected (GSAx).
It is a comparison between the number of expected goals a goalie faces, and the actual goals that get scored against him or her. The difference tells us if a goalie performed better or worse than the shots he or she faced.
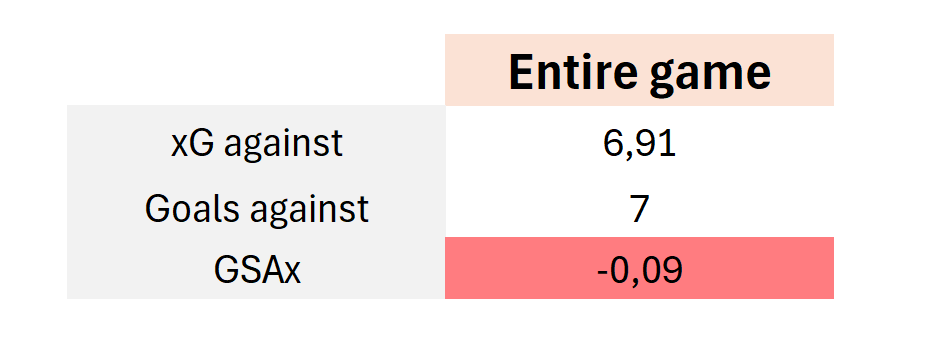
Frejd has a -0,09 GSAx score for this game, meaning that he saved 0,09 goals fewer than expected. More or less exactly what you could expect out of an average goalie in the SSL.
So looking at it this way, he is no longer below average – but actually more or less exactly average.
Let us look at game tape, to see what shots he faced, and how he did. He had some stellar saves, but also some not so good actions. After all, he did let in seven goals on five-on-five play. 👇
🆓 | Free trial for a week!
If you feel like seeing the video below and getting access to the entire xProgress platform for free for a week, click the button below. Cancel anytime.